Data areas are useful for passing a large quantity of information between programs and even systems without creating a lot of parameter fields. They are also useful for distributing application settings. Because they are handled by multiple programs, it is sometimes difficult to understand how a setting in a data area was changed and when it happened.
The IBM i OS supports journaling for data areas. With a journal active on a data area you can see what changes are made, when they were made, what program was used and even see the before and after data contents. We recently had a development issue where a data area was changing and we could not track down the culprit program. By activating a data area journal, we discovered the problem quickly and were able to remedy it.
There is one big restriction in the IBM i OS for data area journaling. You can only journal a named local data area. The special data areas like *LDA, *GDA, *PDA and DDM data areas cannot be journaled.
To journal a data area, you will need to complete these steps:
In the following example, we will show how to journal a 2000 character data area named CONTROL in a library named MYLIB. To do this, we will create a journal receiver named CONTROL and a journal, also with the same name.
The following commands will create the journal receiver and journal and start the journaling process:
CRTJRNRCV JRNRCV(MYLIB/CONTROL)
CRTJRN JRN(MYLIB/CONTROL) JRNRCV(MYLIB/CONTROL)
STRJRNOBJ OBJ(MYLIB/CONTROL) OBJTYPE(*DTAARA) JRN(MYLIB/CONTROL)IMAGES(*BOTH)
In this example, we will capture both the before data area contents and the after data area contents.
Once this has been set up, let your application process. Each time a position or string in the data area is changed, two records will be added to the journal showing the results.
To review the results stored in the journal, you can use this command:
DSPJRN JRN(MYLIB/CONTROL)
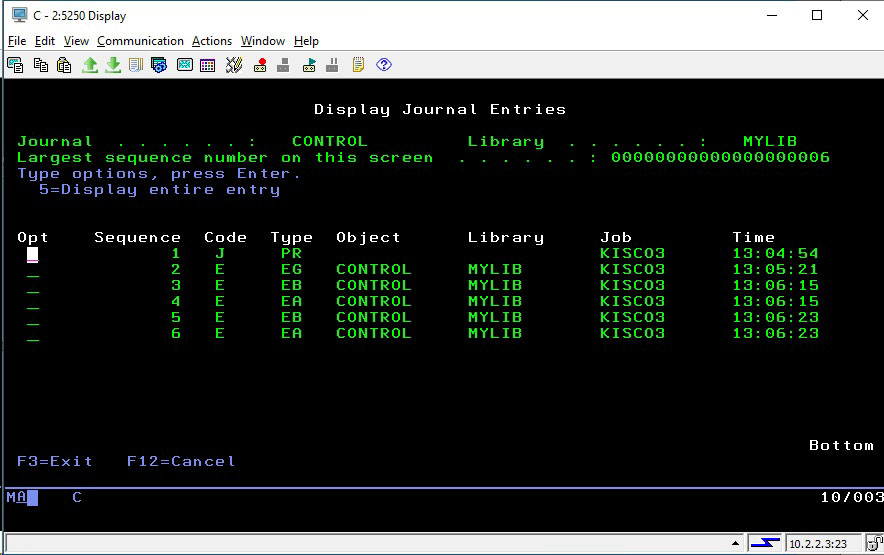
When you do, you will see a display that might look like this:

The “Type” column indicates what kind of journal record is recorded:
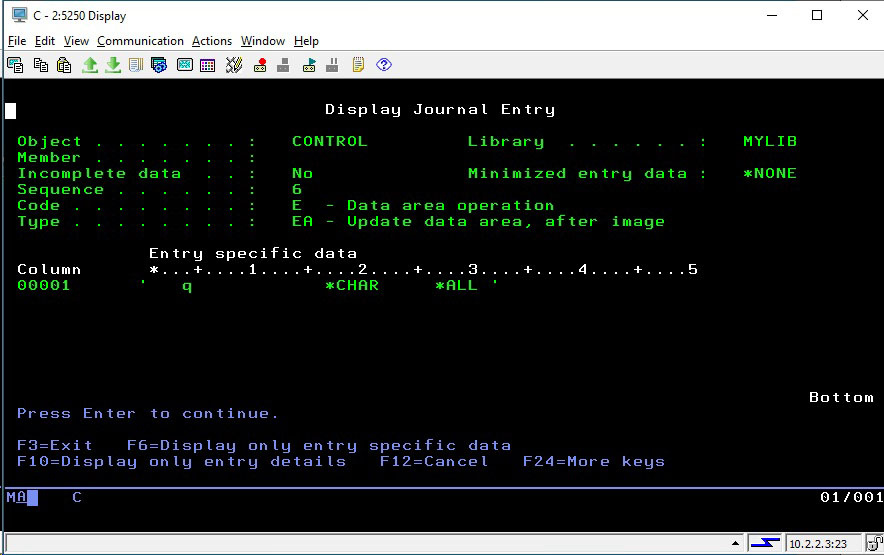
Detail about the change are in the EB and EA records. For this example, we’ll just look at the final EA record. Place a 5 next to it to view it:

In this example, position 1432 of the data area was changed to the value *ALL. You can see the character string changed starting in position 27 of the area shown. To view the specific field position and length, press F6 and then F11 to see the record displayed in hex.

The first four characters point to the data area position and the next 4 characters indicate the number of characters in the string that was changed.
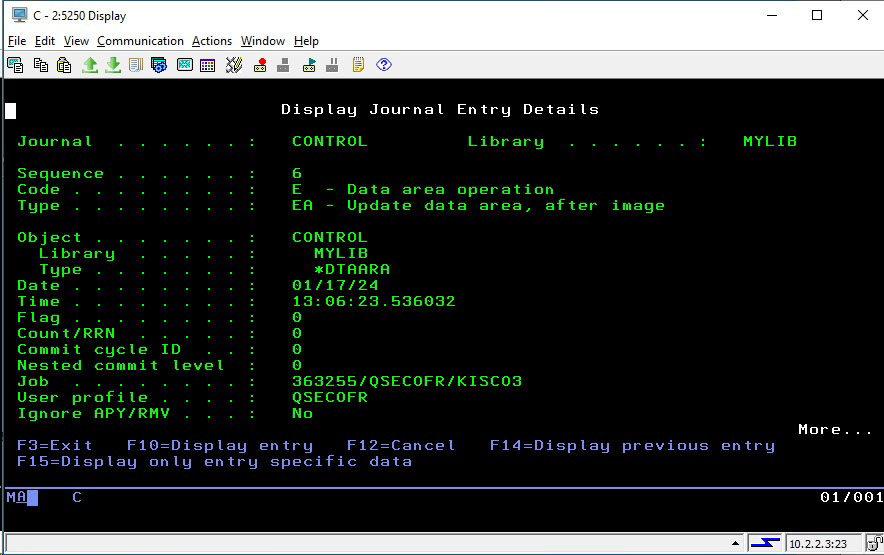
From the original display, you can use the F10 key to display information about when and how the data area was changed.

In this example, you can see that QSECOFR is the guilty party. By scrolling up (not shown) we see that the program used was QCMD which means that the data area was changed using the command line.